Version and health check


Version and health check |
|
| Basic > Troubleshooting Data: How to retrieve them > TradeSense |
TradeSense version checkThe version endpoint displays the version of the components installed in the running instance of the TradeSense.
https://<TradeSense-IP>/version
lizzie: 9.4.3.0 skink: 9.4.0.4 os-upgrade-level: 5 analytics: bayawak-image: 9.4.1.0 bayawak: 9.4.1.0 java-image: 1.1 oel-image: 2.3 kibana-image: 6.5.1.2 ipt-branding: 6.5.3 oel-image: 2.3 assure-maintenance: assure-image: 9.4.3.3 assure-docs: 2.3 base-image: 9.4.1.5 oel-image: 2.11 assure: assure-image: 9.4.3.3 assure-docs: 2.3 base-image: 9.4.1.5 oel-image: 2.11 elasticsearch: elasticsearch-image: 9.4.0.0 java-image: 1.1 oel-image: 2.3 minio-image: 1.0 gecko: gecko-image: 9.4.3.1 gecko: 9.4.3.1 health-check: 0.0.4 java-image: 1.1 oel-image: 2.3 haproxy: haproxy-image: 9.4.1.3 alpine-image: 1.6 jacky: jacky-image: 9.3.7.0 base-image: 9.3.7.0 jacky: 0.0.9 oel-image: 2.3 landing: landing-image: 1.0.2 alpine-image: 1.6 http-image: 1.4 landing: 1.0.1 mail: mail-image: 1.6 alpine-image: 1.6 tilestream: tilestream-image: 1.7 base-image: 9.3.7.0 oel-image: 2.3 version_server: http-image: 1.4 alpine-image: 1.6 Verifying Gecko configurationThere is a status page for Gecko which displays the current "health" of the system
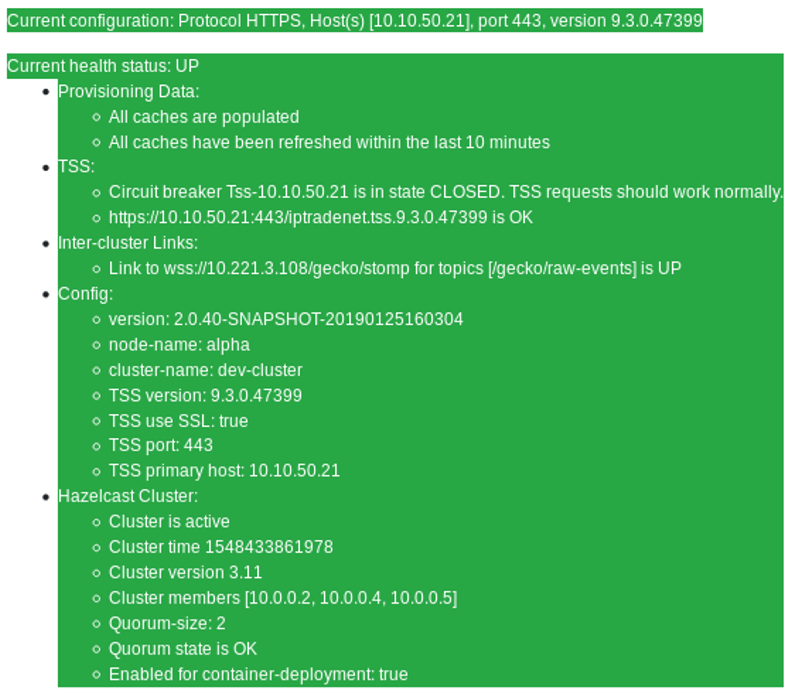
https://<TradeSense-IP>/gecko/status
This is an example of a healthy system, if any issues are detected the status will be "DOWN", the issue will be highlighted in a different color, and will describe the problem.
Verifying Gecko healthAn health summary is available for Gecko.
https://<TradeSense-IP>/gecko/health
The outcome field in the response JSON object can be UP or DOWN indicating whether the application is functioning or not. The checks object reports an indication of the result of the checks performed to determine the final outcome value.
{ "checks": [ { "id": "Provisioning Data", "status": "UP", "data": { "status": [ "All caches are populated", "All caches have been refreshed within the last 10 minutes" ] } }, { "id": "TSS", "status": "UP", "data": { "status": [ "Circuit breaker Tss-TSSVALoadTest1.sfbtest.local is in state CLOSED. TSS requests should work normally.", "https://TSSVALoadTest1.sfbtest.local:443/iptradenet.tss.9.3.3.49620 is OK" ] } }, { "id": "Inter-cluster Links", "status": "UP", "data": { "status": [] } }, { "id": "Config", "status": "UP", "data": { "status": [ "version: 2.0.48-20190429174905", "node-name: NODE-Assure-1", "cluster-name: Cluster-1", "TSS version: 9.3.3.49620", "TSS use SSL: true", "TSS port: 443", "TSS primary host: 10.12.2.50" ] } }, { "id": "Hazelcast Cluster", "status": "UP", "data": { "status": [ "Cluster is active", "Cluster time 1560953245424", "Cluster version 3.11", "Cluster members [10.0.0.41]", "Quorum-size: 1", "No quorum rule in force", "Enabled for container-deployment: true" ] } } ], "outcome": "UP" } Verifying Assure healthAn health summary is available for Assure.
https://<TradeSense-IP>/assure/health
The outcome field in the response JSON object can be UP or DOWN indicating whether the application is functioning or not. The checks object reports an indication of the result of the checks performed to determine the final outcome value.
{ "checks": [ { "data": { "status": [ "RUNNING", "uptime 0:19:39" ] }, "id": "calleventlistener", "status": "UP" }, { "data": { "status": [ "RUNNING", "uptime 0:19:39" ] }, "id": "celery-cdr_correlation", "status": "UP" }, { "data": { "status": [ "RUNNING", "uptime 0:19:39" ] }, "id": "celery-main", "status": "UP" }, { "data": { "status": [ "RUNNING", "uptime 0:19:39" ] }, "id": "celery-wtf", "status": "UP" }, { "data": { "status": [ "RUNNING", "uptime 0:19:39" ] }, "id": "celery-wtf-high-priority", "status": "UP" }, { "data": { "status": [ "RUNNING", "uptime 0:19:39" ] }, "id": "celerybeat", "status": "UP" }, { "data": { "status": [ "RUNNING", "uptime 0:19:39" ] }, "id": "crond", "status": "UP" }, { "data": { "status": [ "RUNNING", "uptime 0:19:39" ] }, "id": "httpd", "status": "UP" }, { "data": { "status": [ "RUNNING", "uptime 0:19:39" ] }, "id": "influx", "status": "UP" }, { "data": { "status": [ "RUNNING", "uptime 0:19:39" ] }, "id": "mysqld", "status": "UP" }, { "data": { "status": [ "RUNNING", "uptime 0:19:39" ] }, "id": "redis", "status": "UP" }, { "data": { "status": [ "RUNNING", "uptime 0:19:39" ] }, "id": "snmptrapd", "status": "UP" }, { "data": { "status": [ "RUNNING", "uptime 0:19:39" ] }, "id": "telegraf", "status": "UP" } ], "outcome": "UP" } Verifying Analytics healthAn health summary is available for Analytics.
https://<TradeSense-IP>/analytics/health
The outcome field in the response JSON object can be UP or DOWN indicating whether the application is functioning or not. The checks object reports an indication of the result of the checks performed to determine the final outcome value.
{ "checks": [ { "id": "Kibana", "status": "UP", "data": { "status": "OK" } }, { "id": "ElasticSearch", "status": "UP", "data": { "status": "OK" } }, { "id": "GeckoCluster", "status": "UP", "data": { "status": "OK" } } ], "outcome": "UP" } |